The data zine was a web-based report designed to help FanThreeSixty better communicate with our customers about their data and how they could use it.
The problem
One of the biggest challenges at FanThreeSixty for many years was articulating what we were actually building. “Fan data” had always been the central theme of the business, but in practice this amounted to a lot of behind-the-scenes code that customers either overlooked or couldn’t see the results of.
As a design team, we were able to bring a unique perspective to this problem. We believed we could deliver a project that would help our internal teams, be useful to customers and also prove out concepts to use later in our product.
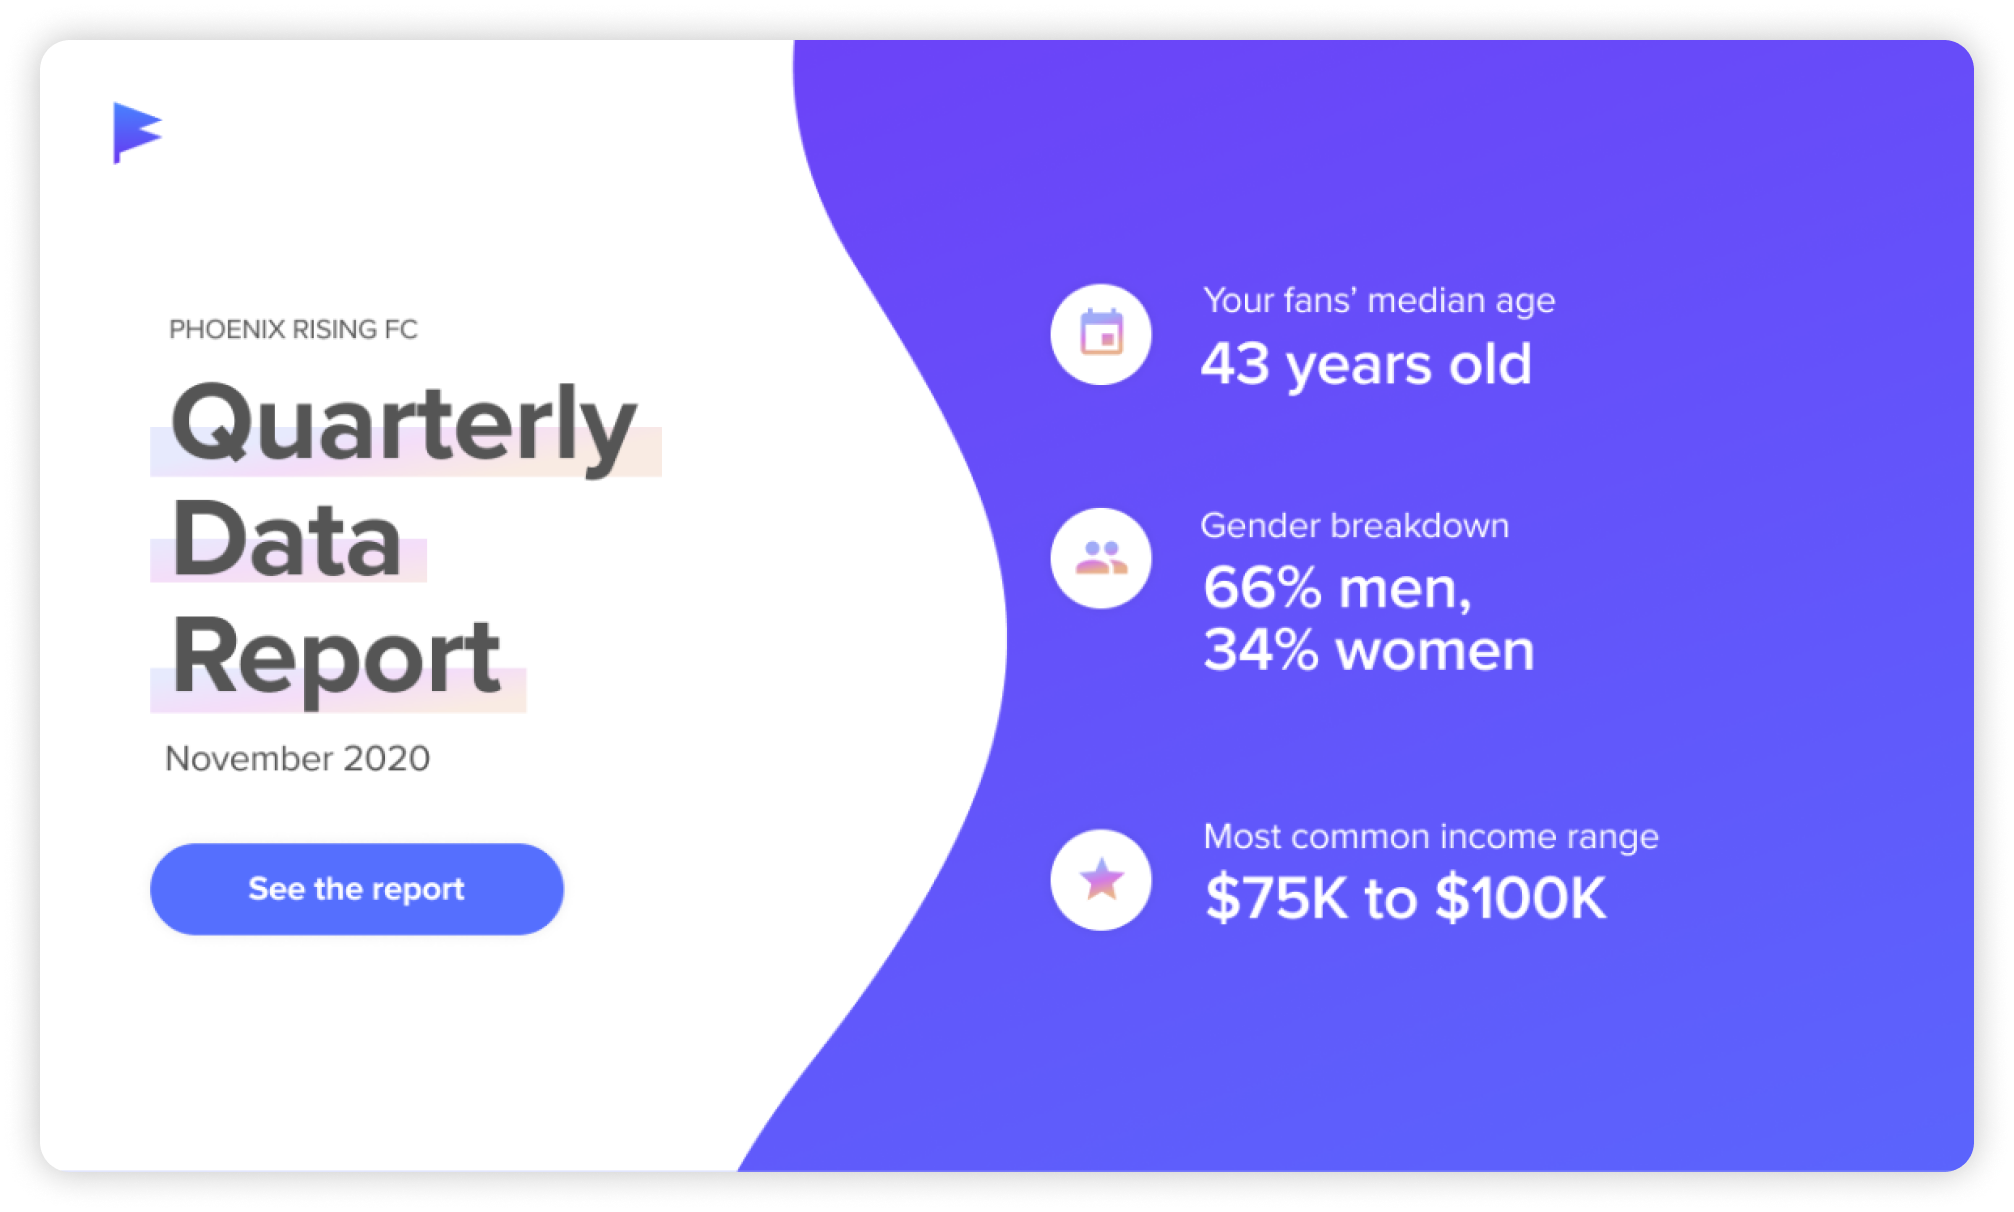
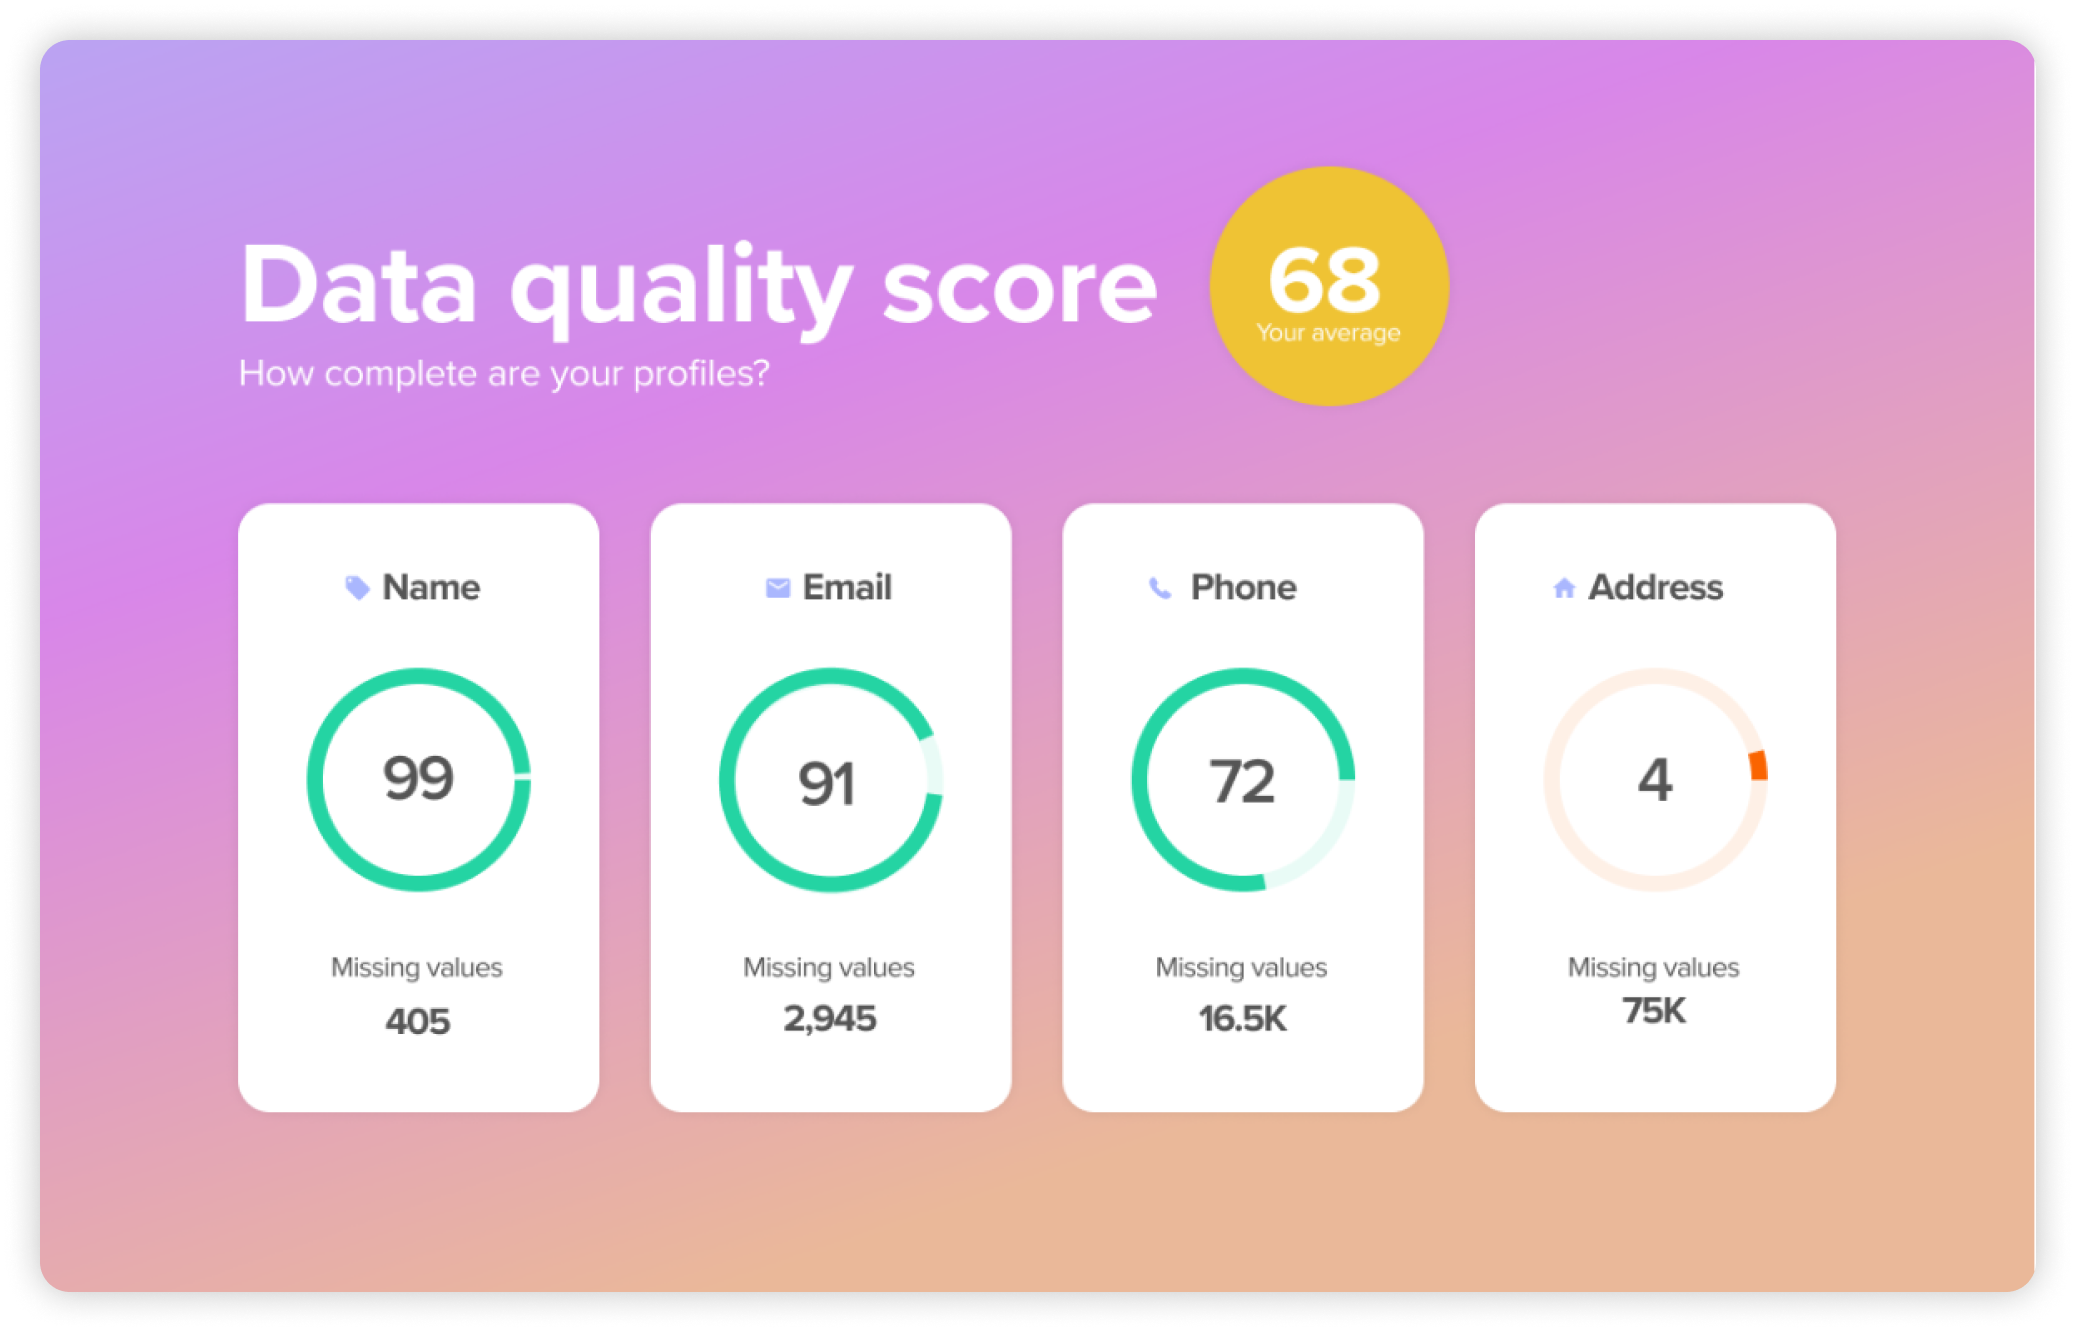 A slide from the third zine
The approach
We liked the way Spotify used bright colors, animations and a silde-style layout to convey data-heavy information in a fun and easily digestible way with their “year in review” feature. Our idea was to send users to a webpage with information about their fan data that was fun, easy to digest, and shareable, in its own way. I dubbed this project a “zine” for its informal, handmade approach.
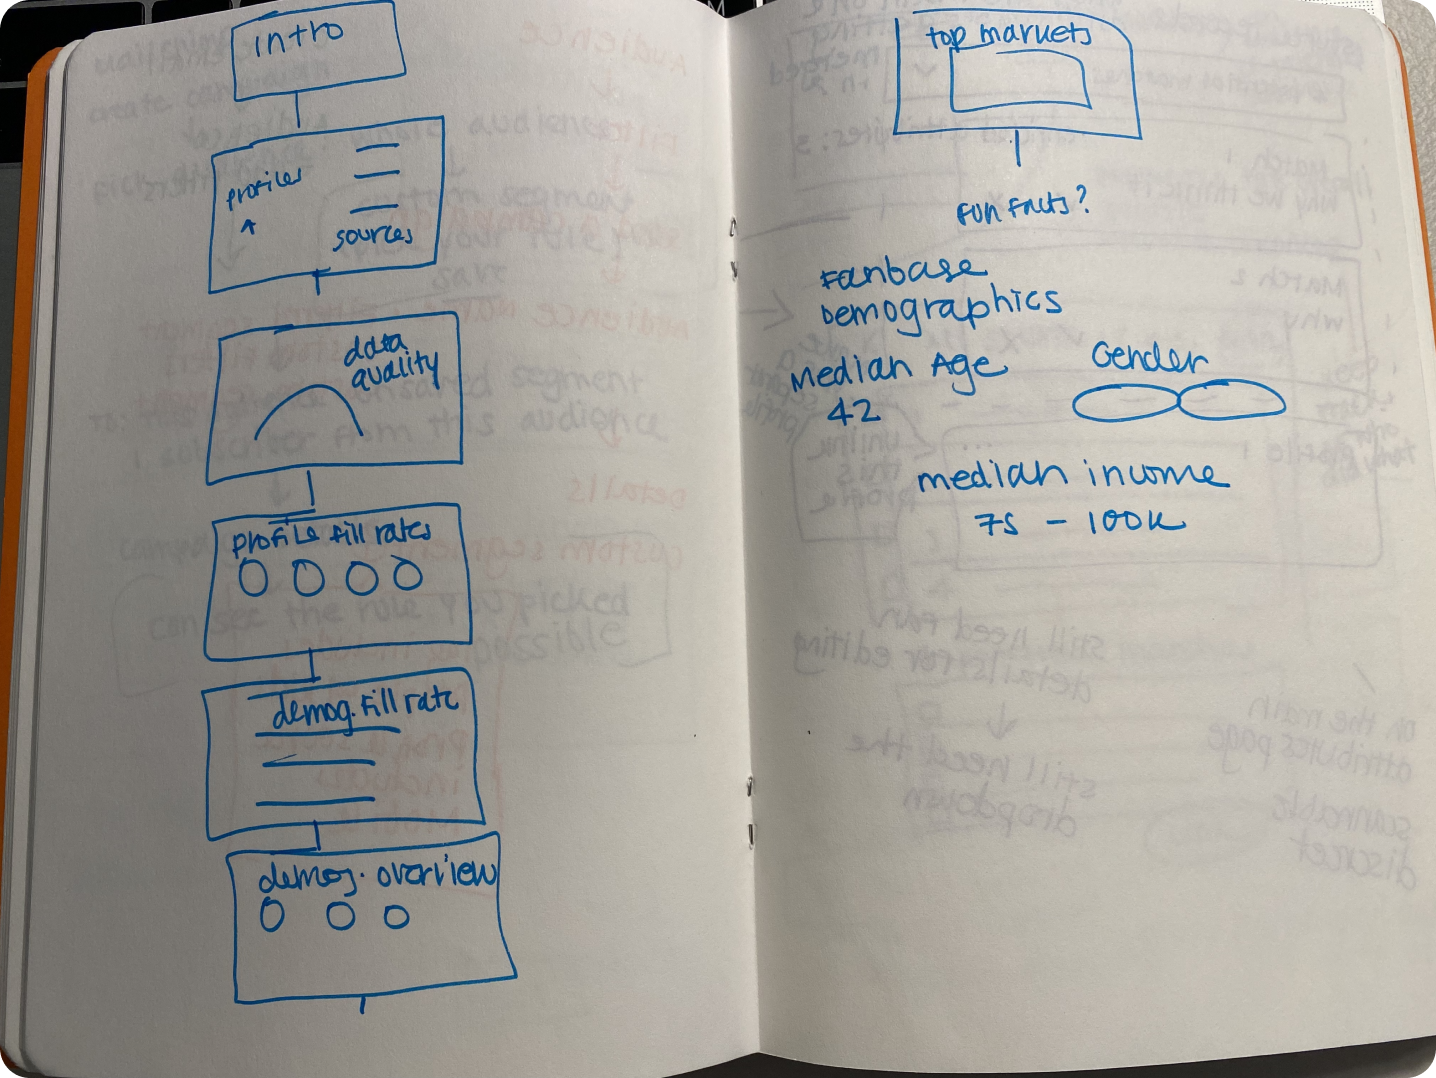 Storyboard for the first zine
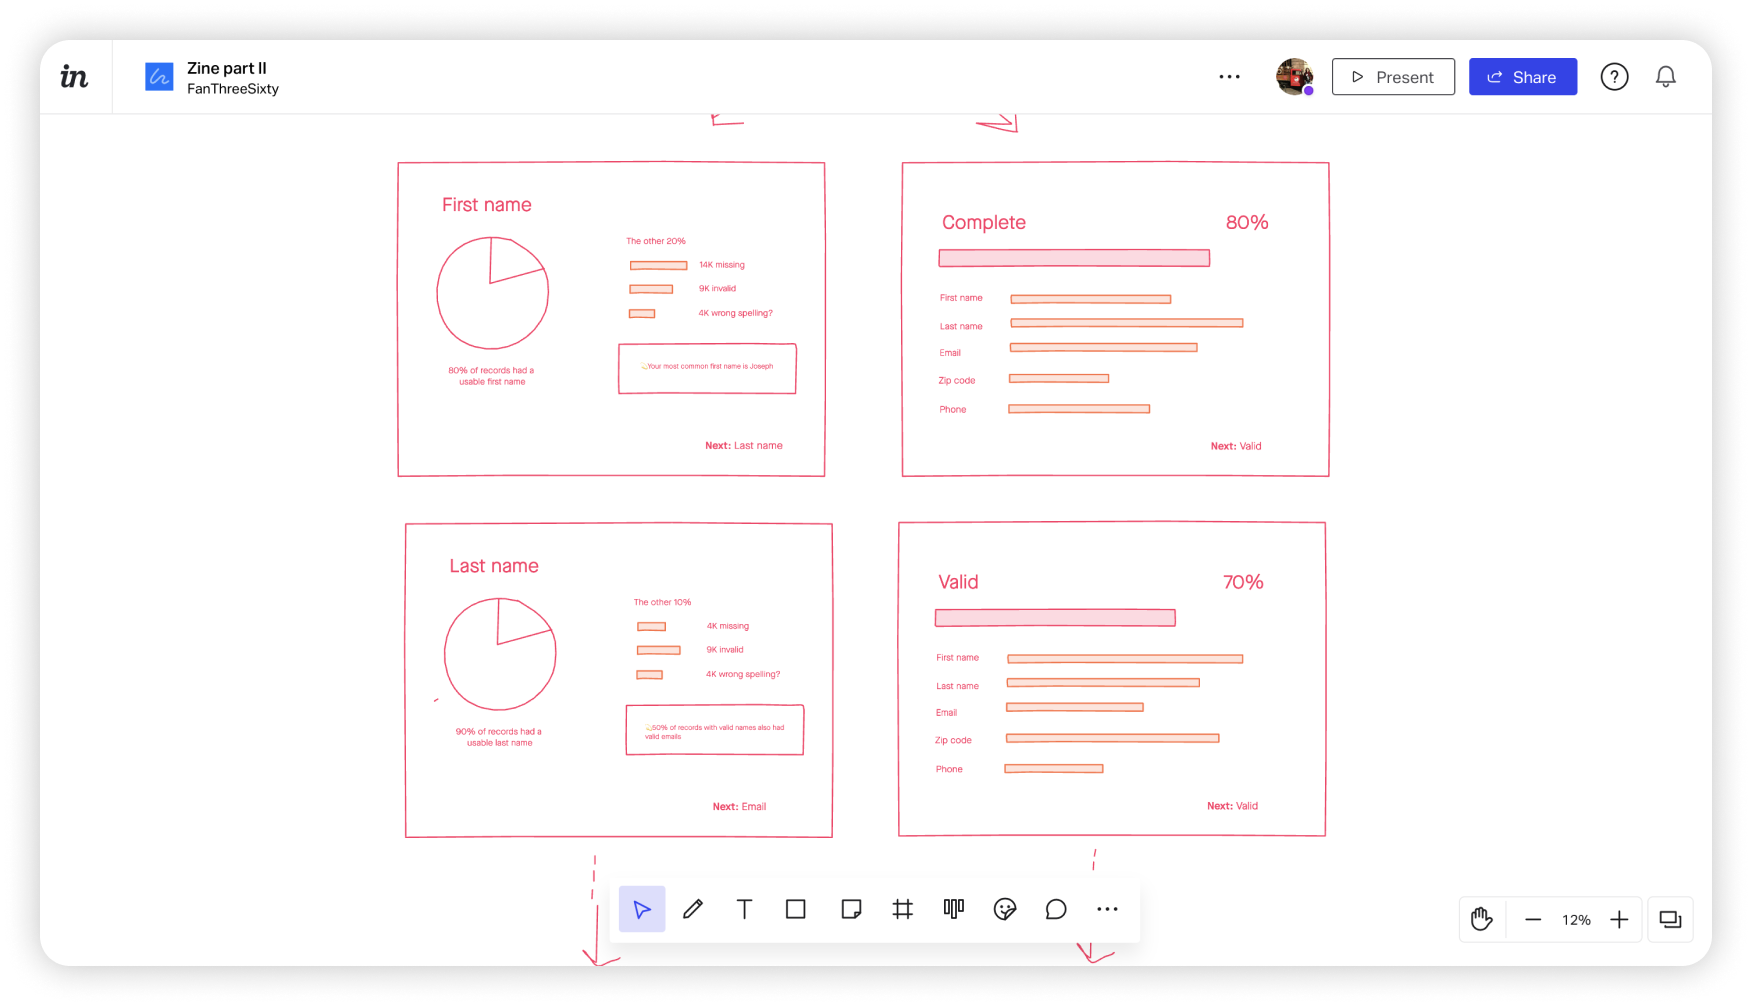 Storyboard for the second zine
I started by gathering the main points we wanted users to know and crafted a storyboard that would create a coherent flow and tell a story. I designed each part of the storyboard as its own full-screen slide. Finally, when we were happy with the design and layout, I coded the website, inputting the data right into the html.
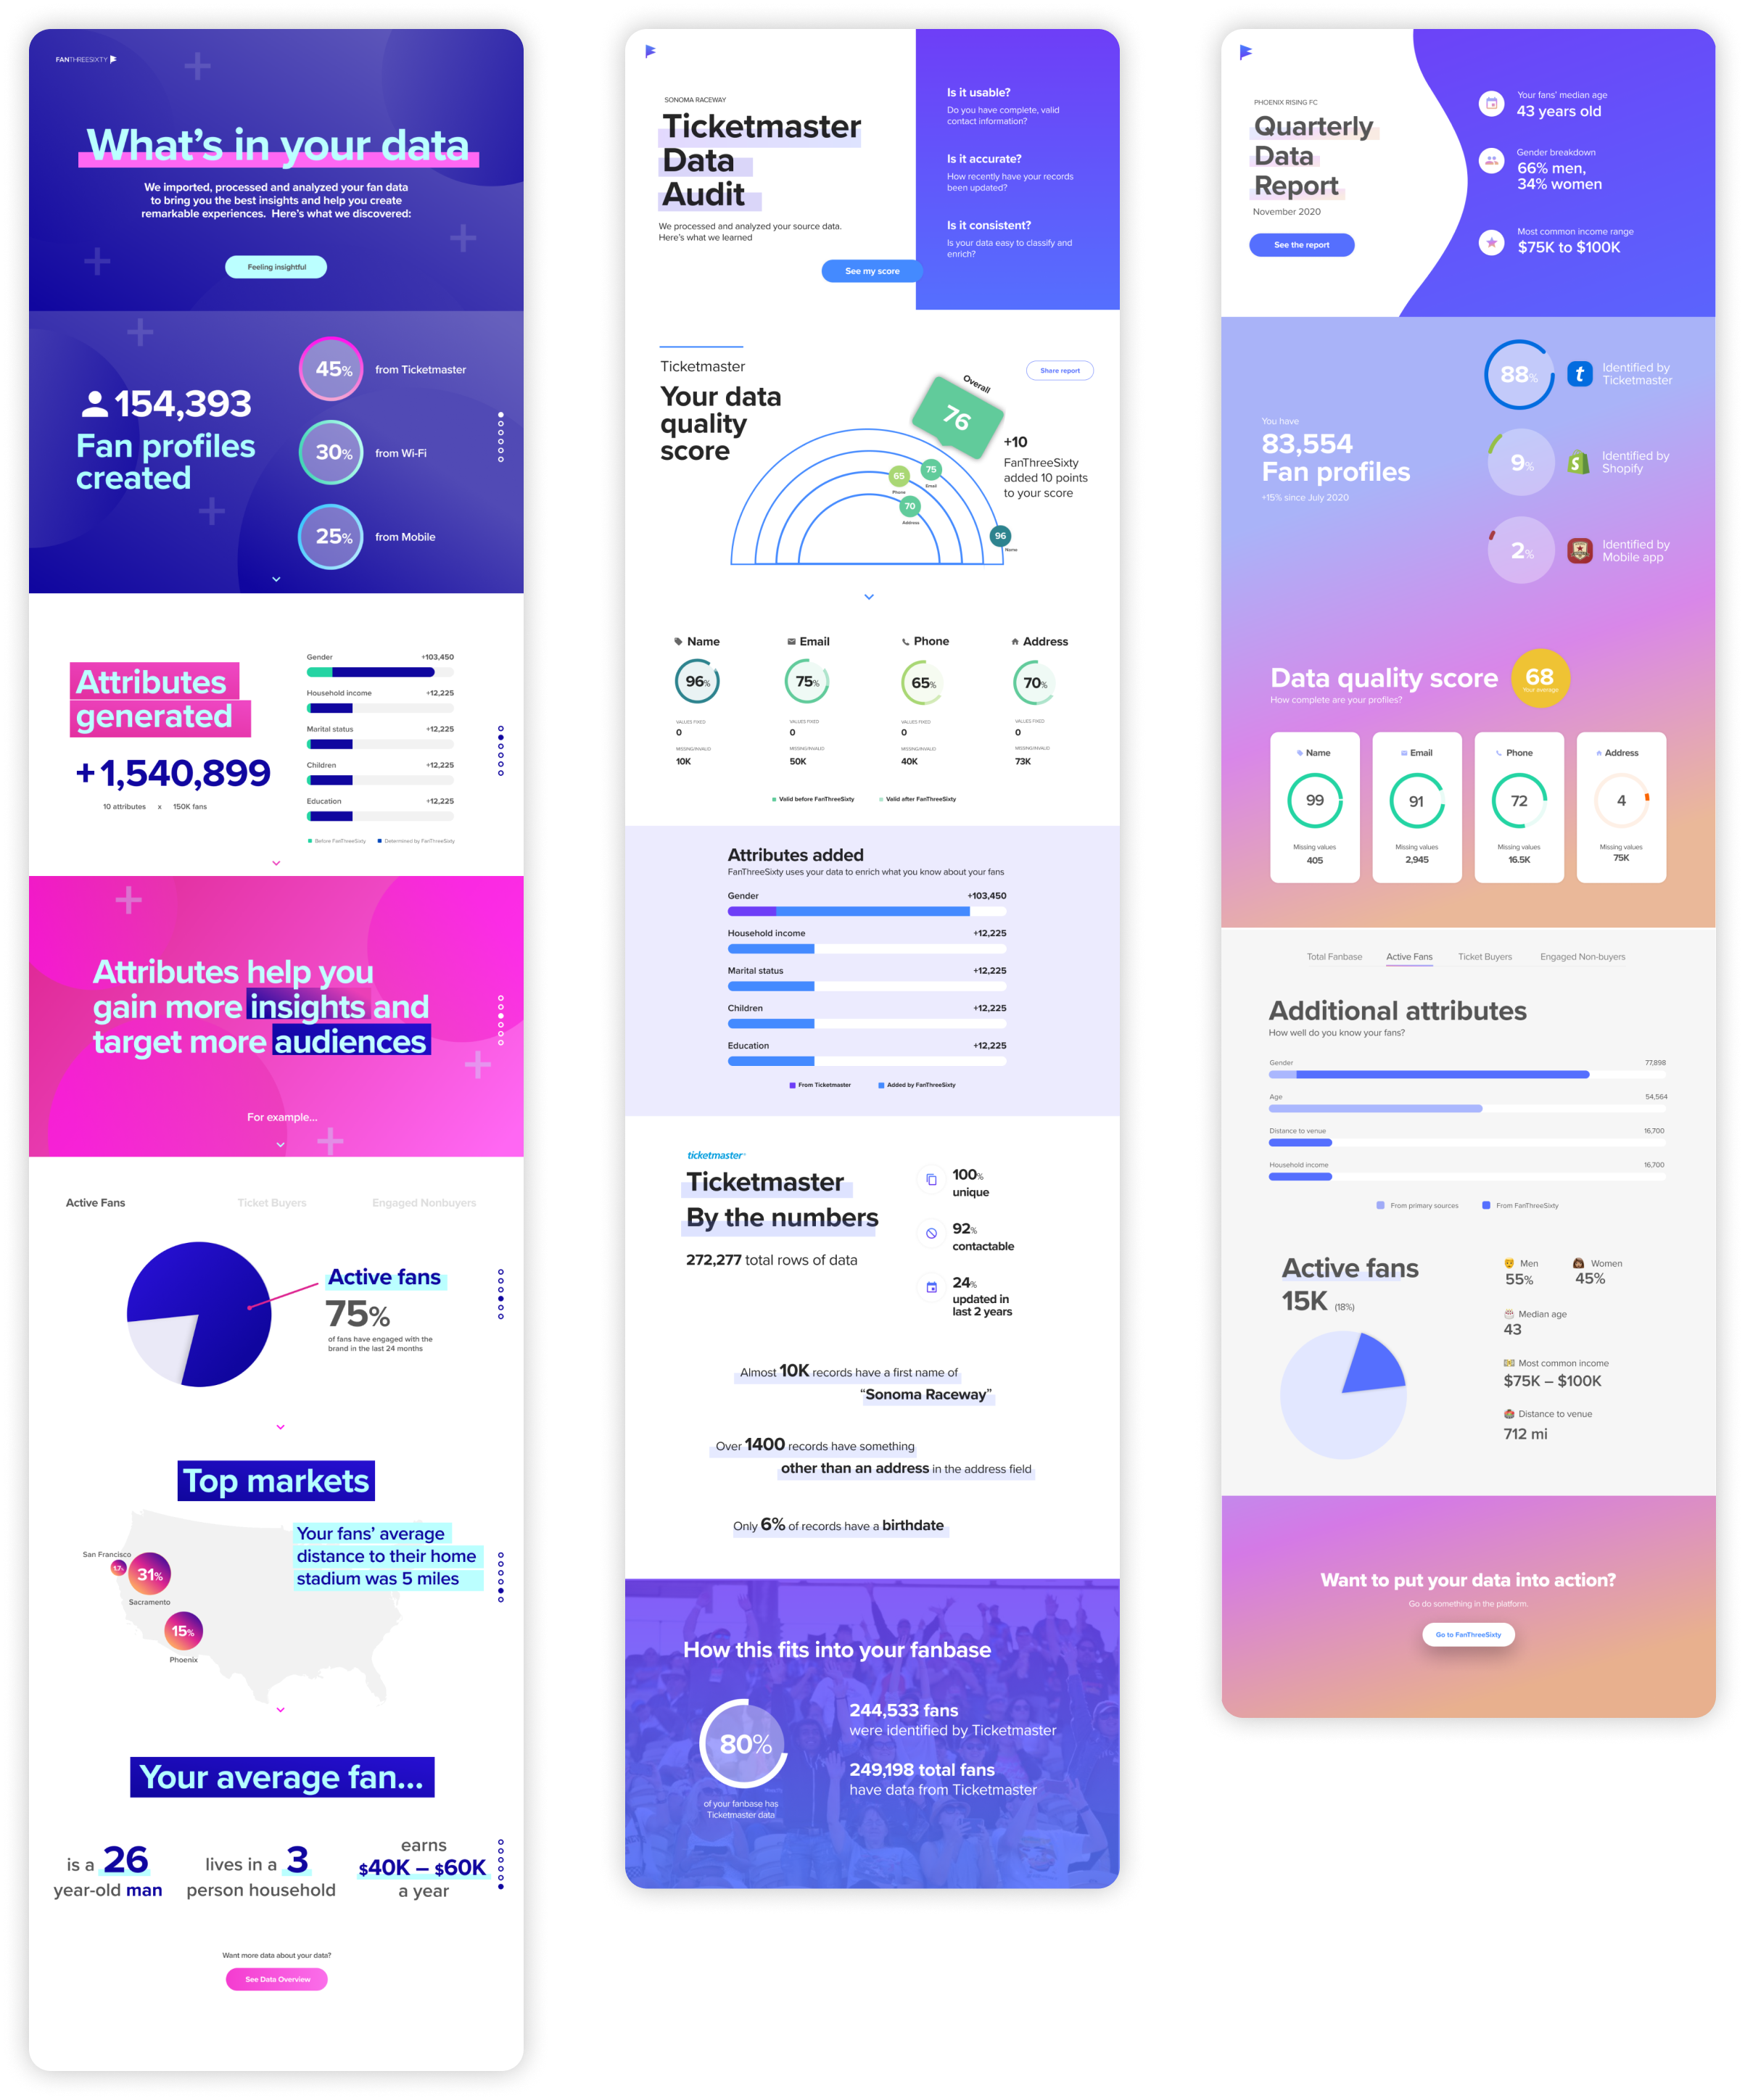 Each of the three zine iterations
The process
- first iteration
I created a version for several different clients. We got positive feedback from both the customers themselves and our client success team, who found it helpful to have a quick, well-designed way to share a data summary with their contacts. - second iteration
During the pandemic lull of 2020, I used a second iteration of the zine to help an engineering colleague prototype some ideas he wanted to validate. This iteration added some new concepts and evolved the design. - third iteration
The third iteration took the best elements of the previous two. Once I finished coding this version, I converted it into a Hubspot template that the client success team could use to create a version for each of their clients. They used this version of the zine in their quarterly client meetings for about a year.
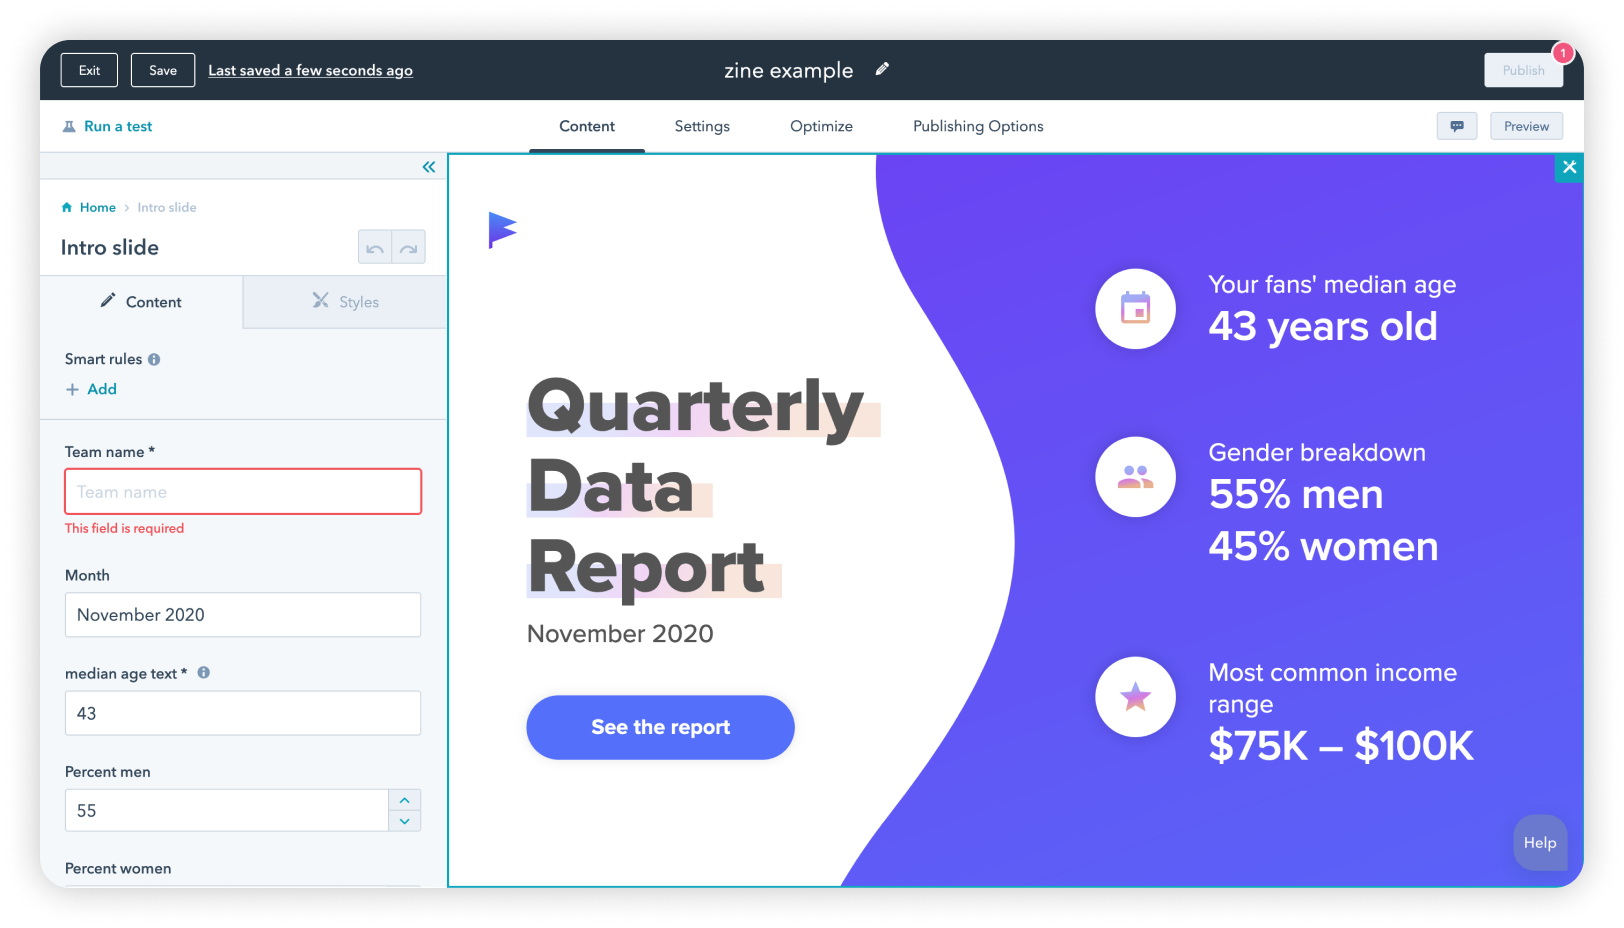 Hubspot template for making new report zines
the results
The zine helped us validate some of the key ideas we wanted to tell clients about their data. Today, much of the information that was in the zine has found its way into the platform—particularly the audience segments and insights. We were also able to prove that it wasn’t hard to put delightful charts directly in the UI, which unblocked a large portion of the roadmap for us.